Transition state theory was first developed by Erying (Princeton), Evans (Manchester), and Polyani (Manchster) in the early 20th century.1 Their early conceptions unified classical thermodynamics, statistical mechanics, and early kinetic theory. The theory is comprised of three major tenets:2
- Rates of reaction can be studied by examining activated complexes near the saddle point of a potential energy surface. The details of how these complexes are formed are not important. The saddle point itself is called the transition state.
- The activated complexes are in a quasi-equilibrium with the reactant molecules.
- The activated complexes can convert into products, and kinetic theory can be used to calculate the rate of this conversion.
Of course, this isn’t a kinetics course so take a look at ref. 2 if you’d like to learn more about TST and how its relation to modern day kinetics. In computational organic chemistry transition states are commonly used to understand how reactions proceed and rationalize selectivities.
So what is a transition state? Drs. Eyring, Evans, and Polyani have clarified for us that we’re looking for a saddle point on the potential energy surface.
Now if you need a quick refresher from Calc III, recall that a saddle point (a.k.a. a minimax point) is a point on a function where the derivative in all directions is zero.4
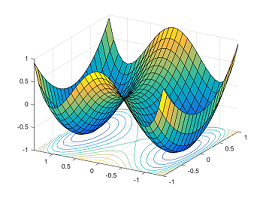
Figure 1. Different types of stationary points. Reproduced from ref 5.
Further, the saddle point must be a first-order saddle point. First-order saddle points are characterized by a single imaginary vibrational frequency (this implies a negative force constant). Physically, this means that in one direction the saddle point is a local maximum while in all others it is a minimum (verify that you understand this visually using the figure above). The imaginary vibrational frequency typically represents the molecular vibration along which the reactants convert into the products. A typical potential energy surface for a reaction looks like:
 Figure 2. A surface with two symmetric local minima (ground states) and a saddle point (transition state). Reproduced from ref 5.
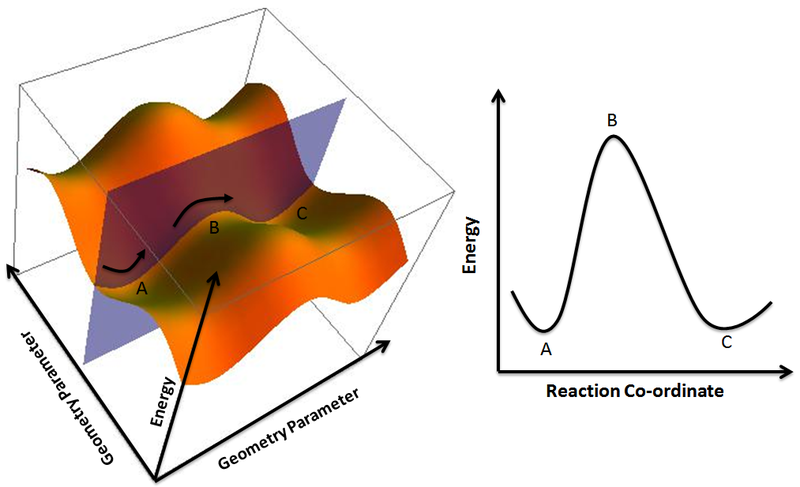
Taking a cross-sectional slice of the surface, along the axis formed by the two minima produces the familiar reaction coordinate diagram that we all know and love:
 Figure 3. Potential Energy Surface and Corresponding 2-D Reaction Coordinate Diagram derived from the plane passing through the minimum energy pathway between A and C and passing through B. Reproduced from ref 6.
Recall of course that this is a vast oversimplification. The reaction coordinate space is 3N-6 dimensional (where N is the number of atoms) so when we draw 3D energy surfaces or 2D reaction coordinate diagrams we’re only looking at slices of a much more complex hypersurface. So now that we know what we’re looking for, we can start to figure out how we’re going to do it. In the next lesson we’ll cover some of the available methods of identifying transition structures.
A tiny bit of pedantry
Strictly speaking, a state is described by its thermodynamic properties, not its structure. In what follows we’ll talk about methods that identify a structure corresponding to the transition state sans vibration. The wide use of the term “transition state” to describe a structure is technically wrong, which is why we will refer to these methods as transition structure search algorithms.
References
(1) K.J. Laidler & M.C. King Development of transition-state theory J. Phys. Chem. 1983, 87 (15), 2657
(2) Transition State Theory
(3) Transition States by Dr. Kalju Kahn
(4) Saddle point
(5) Escaping from Saddle Points by Rong Ge from Off the Convex Path
(6) PES and Reaction Coordinate on Wikimedia